Analysis:
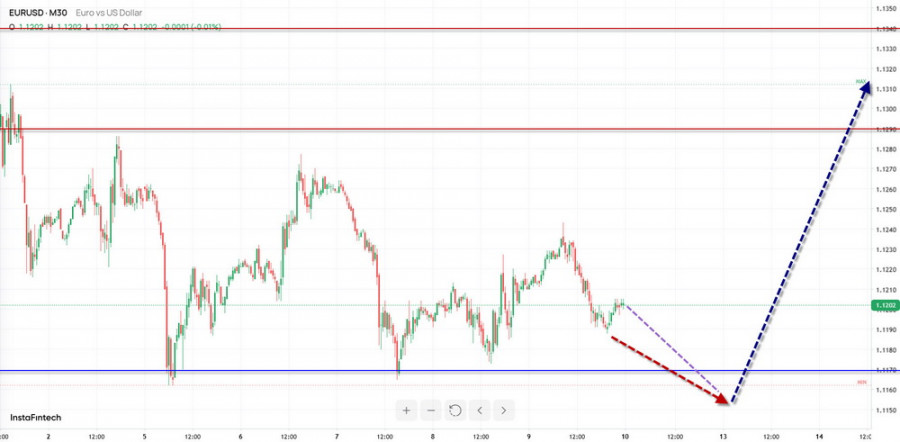
The euro chart has been showing the formation of a short-term downtrend since August of this year. Since October 5, the price has been moving upward from the upper boundary of a major potential reversal zone, forming a sideways correction. At the time of analysis, the structure of this wave remains incomplete.
Forecast:
Over the coming week, the euro is expected to continue trading within an overall sideways range. During the first few days, the price is likely to test the support level and come under pressure. Toward the end of the week, the probability of a reversal and renewed price growth will increase. The resistance level indicates the most likely upper boundary of the expected weekly price range.
Potential Reversal Zones
Resistance:
Support:
Trading Recommendations:
Selling: The limited downward potential may result in losses.
Buying: Buy positions may become viable once the relevant signals appear near the calculated support level according to your trading systems.
Analysis:
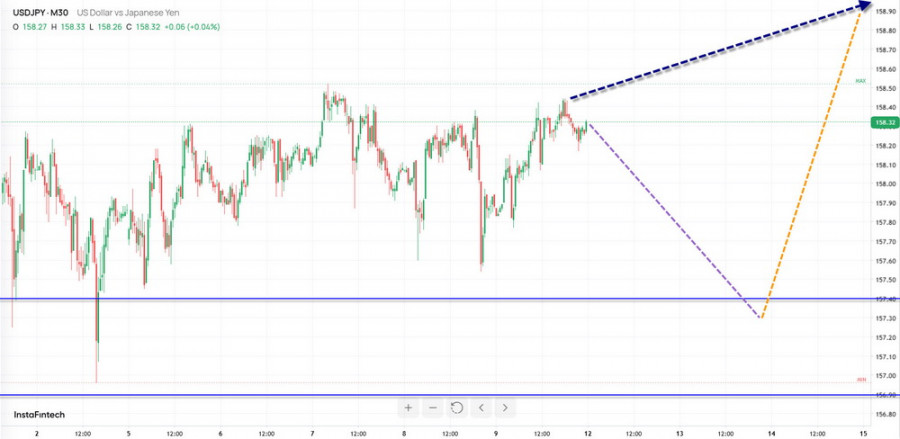
An upward wave has been forming on the Japanese yen chart since April of this year. The wave structure is consistent with one of two possible patterns: a running flat or an elongated flat. The incomplete wave segment (C) began on September 8. The price is moving within a range defined by clusters of potential reversal levels across different timeframes.
Forecast:
Over the next few days, the pair is expected to continue moving sideways overall. A decline toward the boundaries of the calculated support level is possible. Subsequently, the price is expected to enter a sideways phase, form a reversal, and resume rising.
Potential Reversal Zones
Resistance:
Support:
Trading Recommendations:
Buying: Buying opportunities may arise during individual trading sessions using small position sizes. Upward potential is limited by the resistance zone.
Selling: Selling is premature until confirmed signals from your trading systems appear near the resistance zone.
Analysis:
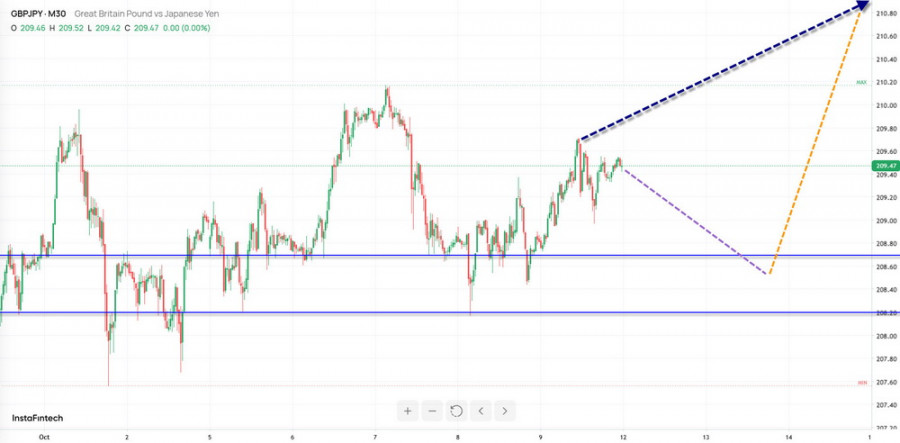
Over the past two months, the GBP/JPY pair has been forming an upward wave structure resembling a running flat. The incomplete segment of the main wave, (C), began on September 8. The wave structure remains incomplete. In recent weeks, the price has been moving predominantly sideways.
Forecast:
At the beginning of the coming week, the price is expected to decline toward the boundaries of the support level. Subsequently, the pair may enter a sideways consolidation phase before rising toward the calculated resistance zone. The lower boundary of a major potential reversal zone on a higher timeframe lies within this area.
Potential Reversal Zones
Resistance:
Support:
Trading Recommendations:
Selling: Selling opportunities may arise at the beginning of next week, using small position sizes.
Buying: Buying offers limited potential until the relevant reversal signals appear near the support zone according to your trading systems.
Analysis:
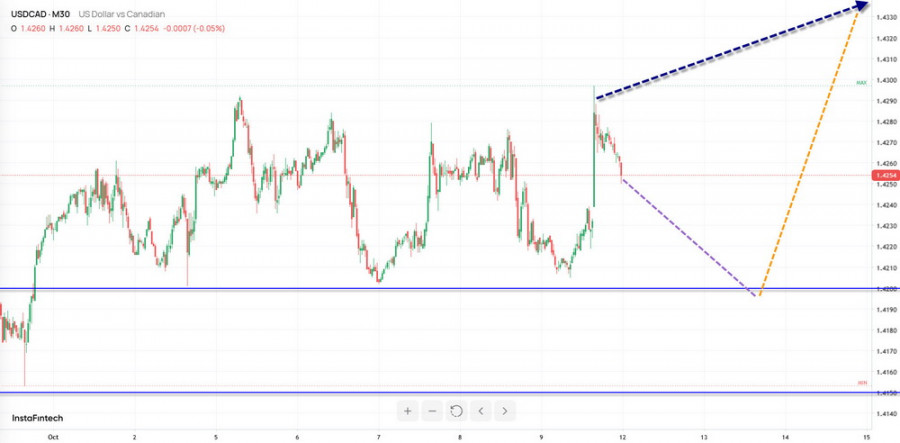
Since August of this year, the US dollar/Canadian dollar pair has been forming an upward wave. The final segment of wave (C) began in mid-September and remains incomplete. The price has broken through an intermediate resistance boundary, which has now become support. Before the upward move can continue, the price needs to develop a higher-degree wave structure during sideways consolidation.
Forecast:
At the beginning of the coming week, the pair is expected to move sideways overall, with the exchange rate declining toward the boundaries of the calculated support zone. A period of sideways drift may follow. A brief break below the lower boundary of support cannot be ruled out. Toward the end of the week, the probability of a reversal and a renewed bullish move will increase.
Potential Reversal Zones
Resistance:
Support:
Trading Recommendations:
Buying: Buy positions may become viable once the relevant signals from your trading systems appear near the support zone.
Selling: Selling may be considered using small position sizes for intraday trading.
Analysis:
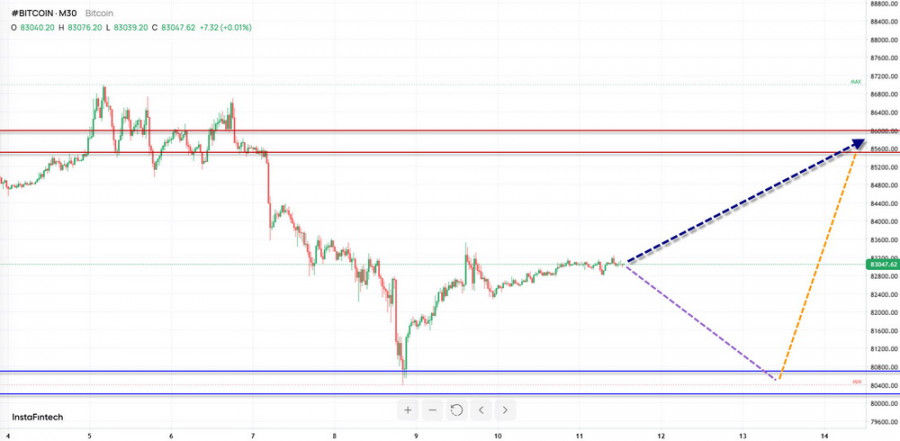
Wave analysis of the dominant bullish trend that began in February of this year suggests that the current downward correction is approaching completion. The correction began on August 21 and has taken the form of a running flat. The final segment of the corrective structure is currently developing. Once it is complete, the instrument is expected to resume its upward movement.
Forecast:
Over the next couple of days, Bitcoin is expected to continue moving downward, with the price potentially declining to the support zone. The price is then likely to move sideways in this part of the chart. Toward the end of the week, the cryptocurrency may gain momentum and resume its upward movement.
Potential Reversal Zones
Resistance:
Support:
Trading Recommendations:
Selling: Downward potential is limited, making selling risky and potentially unprofitable.
Buying: Buy positions may become viable once the relevant signals from your trading systems appear.
Analysis:
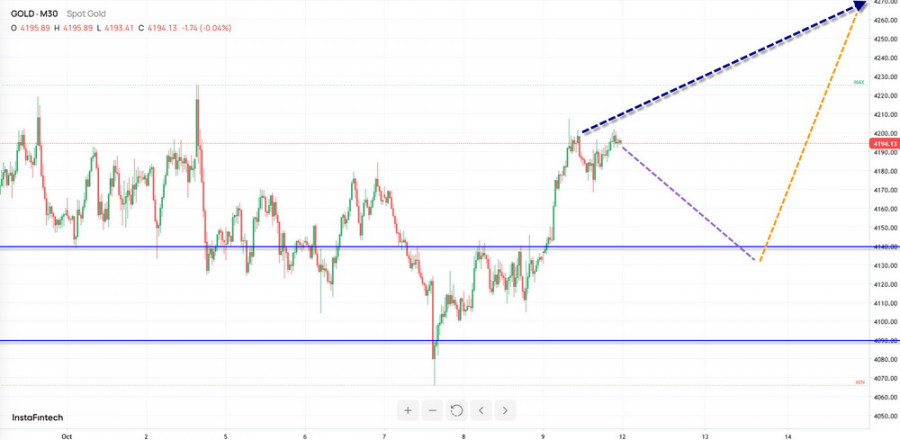
A downward wave has been forming on the gold chart since late January of this year, setting the direction for short-term price fluctuations throughout the year. Over the past three months, prices have been moving predominantly sideways within a cluster of potential reversal levels across different timeframes. The wave structure analysis does not indicate that the wave has been completed as of the time of analysis.
Forecast:
During the coming week, gold is expected to continue trading within an overall sideways range. At the beginning of the week, another decline toward the support zone is likely. Subsequently, a reversal and renewed price growth may follow. The price could rise as far as the resistance zone.
Potential Reversal Zones
Resistance:
Support:
Trading Recommendations:
Selling: Selling may be risky due to the limited downward potential.
Buying: Buying opportunities may arise using small position sizes once the relevant signals from your trading systems appear near the support zone.
Notes: Under simplified wave analysis (SWA), all waves consist of three segments (A-B-C). The latest incomplete wave is analyzed on each timeframe. Expected price movements are indicated by dashed lines.
Warning: The wave algorithm does not take into account the time required for instruments to complete their price movements.
ForexMart is authorized and regulated in various jurisdictions.
(Reg No.23071, IBC 2015) with a registered office at First Floor, SVG Teachers Co-operative Credit Union Limited Uptown Building, Corner of James and Middle Street, Kingstown, Saint Vincent and the Grenadines
Restricted Regions: the United States of America, North Korea, Sudan, Syria and some other regions.





















 コンタクトする