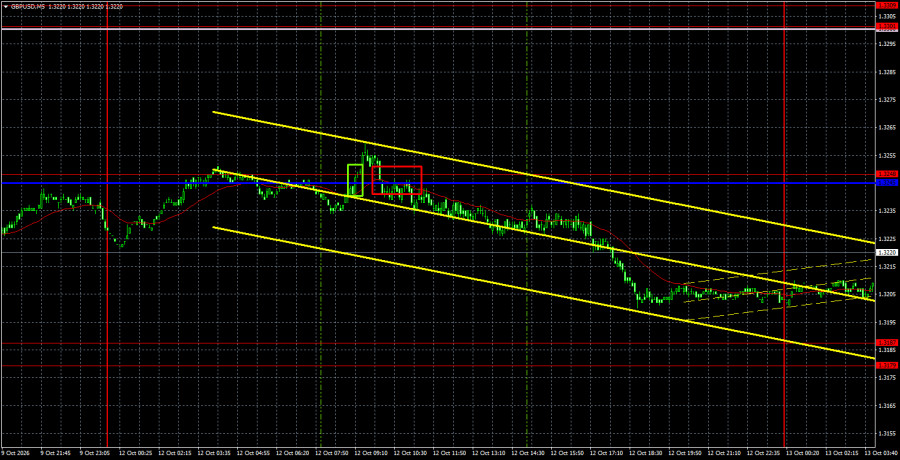
The GBP/USD currency pair also traded lower on Monday, yet the pound has successfully withstood the dollar for two and a half weeks. For two and a half weeks, the pair has been trading inside a sideways channel 1.3187–1.3301, which gives it hope for recovery in the future. The technical picture for the British pound is much more favorable and comprehensible than for the euro. Start with the fact that the pound's movement is quite logical and orderly. The weekly chart shows a flat, the daily chart shows a flat, and the hourly chart shows a flat. Within any flat, moves can be random and resist analysis and logic. Thus, for the pound, we observe quite orderly price movements. Now the further prospects for the British currency depend on whether the market can breach the three lower boundaries of the sideways channels located in the 1.3150–1.3180 area. Will such a breach be a false breakout or simply liquidity taking from a series of local and global lows visible on any timeframe? We still believe there are no grounds for further decline of the pair. Therefore, we expect, at minimum, a new wave of appreciation within all the sideways channels. But for that to happen, the euro must stop falling almost every day.
Technically, the British pound continues forming a downward trend despite breaking the trendline. Recall that in flat conditions a trendline breakout does not mean a change of trend to the opposite. A flat is a market pause and should not be counted when determining the trend. Below the Senkou Span B line, the bearish bias remains.
On the 5-minute timeframe, two trading signals were formed on Monday. Unfortunately, the first buy signal proved false, but the second sell signal allowed traders to realize profit and offset losses from the first trade. The pound again fell to the lower boundary of the local sideways channel.
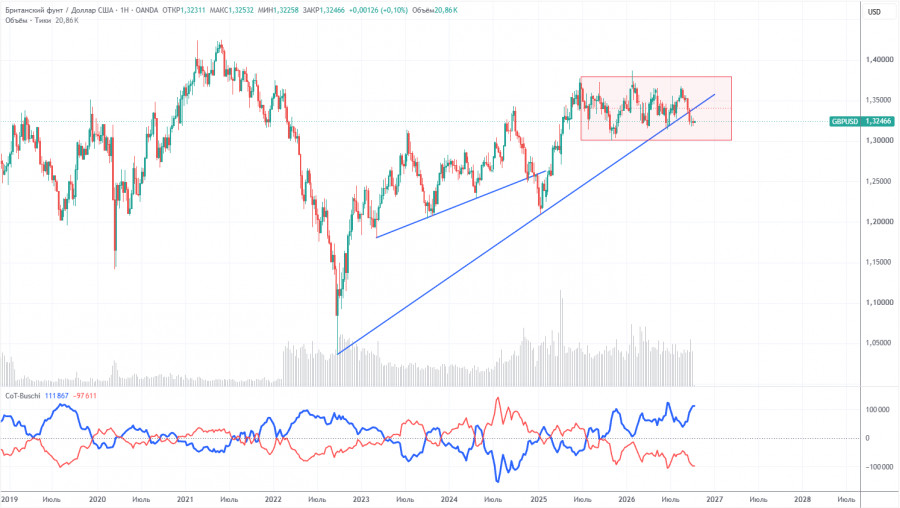
COT reports for the pound show that non-commercial traders have dominated on the sell side for several months. The net position is negative, despite the preservation of the long-term uptrend. Given events in the Middle East, it is unsurprising that demand for the dollar remains fairly high in 2026. The war between the US and Iran has been formally paused, but a new conflict has begun within Yemen. The Federal Reserve's shift in monetary policy stance also supports the dollar, and the uptrend line has been breached. However, it was breached within a flat, so we do not consider the uptrend finished.
In the long term, the dollar continues to decline due to Donald Trump's policies, which is clearly visible on the weekly timeframe. The trade war will continue in one form or another for a long time, and Trump's policies aim, directly and indirectly, to weaken the US currency. The long-term uptrend remains intact. According to the latest COT report (October 6), the "Non-commercial" group opened 3,800 BUY contracts and 10,400 SELL contracts. As a result, non-commercial traders' net position fell by 6,600 contracts over the week.
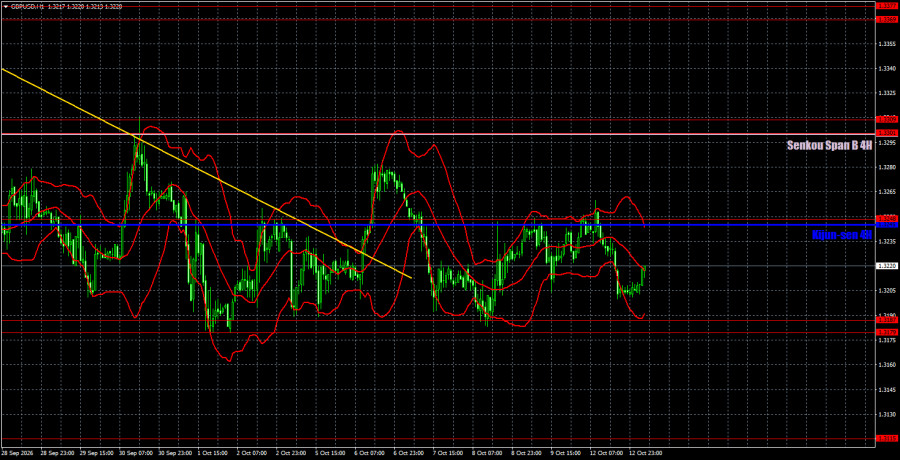
On the hourly timeframe, the GBP/USD pair continues forming a downward trend and has been flat for two and a half weeks. The Fed's decision and stance in September changed a lot in the prospects for the US dollar and the market's attitude toward it. We would say that twice this year a "black swan" came to the market, providing powerful support for the dollar when no one expected it. Now a third "black swan" may arrive in the form of a war in Yemen, which could potentially lead to a blockade of the Bab al-Mandeb Strait.
For October 13 we highlight the following important levels: 1.3042–1.3050, 1.3096–1.3115, 1.3179–1.3187, 1.3248, 1.3301–1.3309, 1.3369–1.3377, 1.3465–1.3480, 1.3588, 1.3671–1.3681. The Senkou Span B (1.3301) and Kijun-sen (1.3245) lines may also be sources of signals. It is recommended to move Stop Loss to breakeven once price has moved 20 pips in the correct direction. The Ichimoku indicator lines may shift during the day, which should be taken into account when determining trading signals.
Today there are no important events scheduled in the UK or the US. Therefore, the pair will most likely remain within the two-week sideways channel, and market moves will be weak.
Traders may consider the 1.3096–1.3115 area as a target for short positions if price closes below the 1.3179–1.3187 area. A rebound from the 1.3179–1.3187 area would allow the 1.3245–1.3248 area to be considered a target for long positions.
ForexMart is authorized and regulated in various jurisdictions.
(Reg No.23071, IBC 2015) with a registered office at First Floor, SVG Teachers Co-operative Credit Union Limited Uptown Building, Corner of James and Middle Street, Kingstown, Saint Vincent and the Grenadines
Restricted Regions: the United States of America, North Korea, Sudan, Syria and some other regions.





















 コンタクトする